Weekly Austin Real Estate Market Update
Austin Real Estate Weekly Market Update – July 31, 2025
by: Dan Price, Broker at Team Price Real Estate
Austin's leading data analysis brokerage, where data drives exceptional service
Published on: Thursday, July 31, 2025 at 07:18 am
Austin Market Update: Inventory Expands 10.1%, Buyer Opportunities Strengthen
The Austin housing market continues to expand its available supply, with active listings across the Austin-Area MLS reaching 17,767—up 10.1% compared to last year. Months of Inventory has increased to 6.10, giving buyers more leverage and options than they’ve had in recent years. Pricing remains resilient overall, with the average sold price up 2.1% to $573,090. However, the median sold price held steady at $435,000, signaling a more balanced environment where mid-tier pricing is stabilizing while higher-end properties continue to see modest gains.
Within the City of Austin, inventory growth is even stronger, rising 11.7% year over year to 5,579 active listings. Months of Inventory now stands at 6.63, reflecting a continued shift toward a buyer-favored market. Pricing shows encouraging signs of firmness, with the median sold price climbing 2.3% to $588,500 and the average sold price increasing 1.4% to $757,993. This mix of expanding inventory and steady pricing is creating an ideal window for buyers to make confident moves while sellers who price strategically are still achieving strong results. The market remains competitive at the right price points, with negotiability improving and opportunities broadening across much of the region.

Austin Real Estate Market Overview
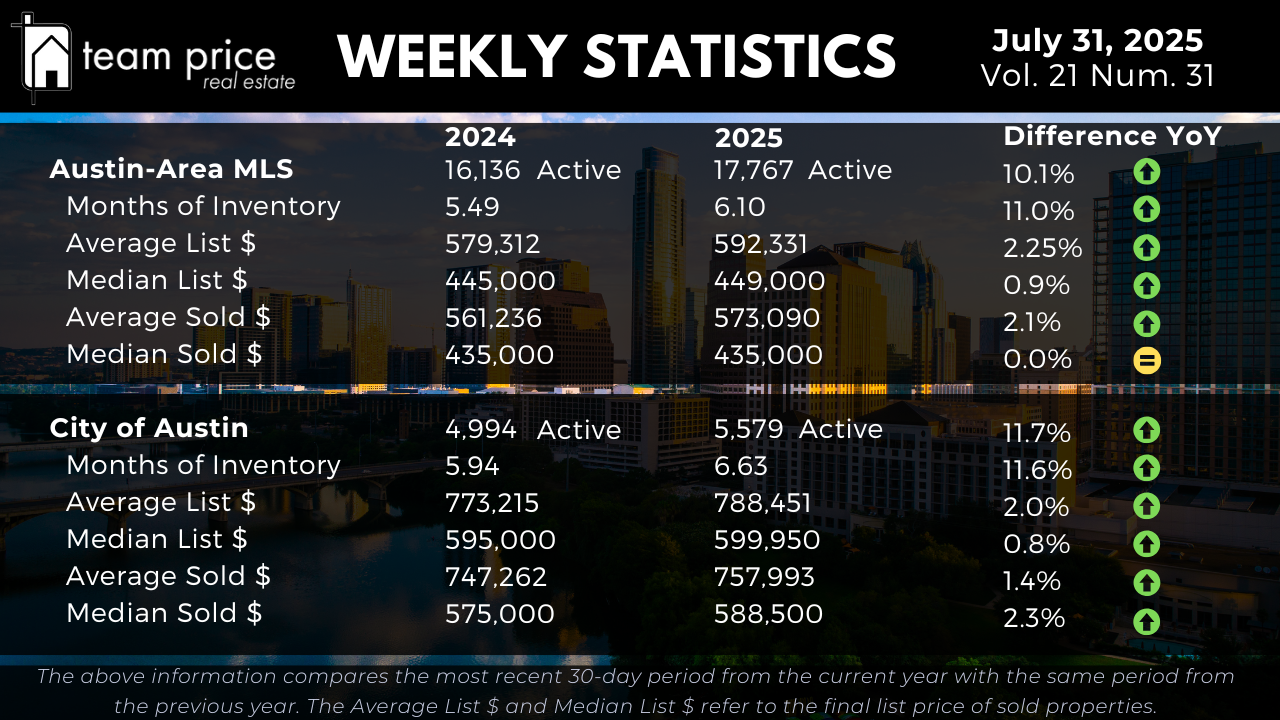
Active listings across the Austin-Area MLS now total 17,767, up 10.1% from 16,136 in July 2024. The Months of Inventory increased to 6.10, an 11.0% year-over-year rise, reflecting a 1.1× expansion in supply relative to current sales activity. Within the City of Austin, active inventory rose 11.7% to 5,579 listings, and Months of Inventory climbed to 6.63, up 11.6% over last year. Compared with last week, active listings across the region declined slightly, but remain elevated year over year—indicating growing buyer selection and negotiation potential in an increasingly balanced market.
Austin Housing Prices: Tweaks at the Top, Mid‑Tier Stability
Across the Austin real estate market, price trends remain mixed. The average list price rose to $592,331 (a 2.25% increase), while the median list price ticked up just 0.9% to $449,000. The average sold price rose 2.1% to $573,090, but the median sold price held steady at $435,000, signifying a flat mid-tier home pricing structure. These dynamics mean affordable homes in Austin maintain consistent pricing while upper-tier listings continue to lift averages.
In the city proper, the average list price moved to $788,451 (+2.0%) and the median list price to $599,950 (+0.8%). The average sold price climbed 1.4% to $757,993, and the median sold price increased 2.3% to $588,500 compared to last year. While prices are firming slightly, the divergence between average and median suggests mid-range Austin home values remain the most stable segment.
Regional Trends: Austin-Area Price Trends Show Mixed Signals
Within the Austin-Area (not Central Texas), trending conditions across tracked cities show modest improvement. Out of 30 zip-level markets tracked, 43% recorded Month-over-Month price gains and 57% saw declines. Year-over-year, 37% of cities posted price gains, while 63% fell. Only one zip code in the region has surpassed its 12-month peak, and the rest remain below prior highs—demonstrating that most subdivisions are still adjusting.
List‑to‑Sale Price Performance: Negotiation Continues
Price concession activity remains notable. 70.37% of homes sold under list price this month, up from 65.87% last month. Exactly 17.62% sold at list price, down from 21.86%, and 12.01% sold above list price—slightly lower than last month’s 12.27% and July 2024’s 13.21%. The average sold-to-list price ratio is 97.11%, underscoring negotiation leverage for buyers in most cases.
Peak Value Trends: Listings and Sales Still Below Historic Highs
Current values in the Austin‑Area remain well below their 12‑month and 2022 peaks. The average list price declined 11.9% from April 2025’s high of $711,541 to $626,576. The median list price dropped 13.9% from May 2022’s $539,900, now at $465,000. On the sales front, the average sold price is down 13.8% from its May 2022 peak to $573,090, and the median sold price is 19.1% below its peak, currently at $435,000. Price-per-square-foot metrics remain approximately 21–23% below their historic highs.
In Austin city limits, the average list price is down 14.3% from its April 2025 high of $945,362, now at $810,436, while the median list price dipped 12.7% from its May 2022 peak to $575,000. The average sold price is 10.6% below its May 2022 high, at $757,993, and the median sold price is 13.5% below peak, at $588,500. Price-per-square-foot measures remain over 20% off prior highs—highlighting the ongoing adjustment from record levels.
Austin Area Residential Sales Insights
Austin Housing Market Questions and Answers
1. Is the Austin housing market still in a cooling phase or returning to normal?
The Austin-area market remains in a correction phase, not a return to hyper‑heated conditions. Inventory is up 10.1% year‑over‑year to 17,767 listings, and Months of Inventory has risen to 6.10—both well above balanced‑market thresholds. Only 37% of tracked zip‑level markets show rising prices year-over-year, and just one of 75 zip codes has moved above its 12‑month price peak. These indicators—combined with 70.4% of homes selling below list price and an average sold-to-list ratio of 97.11%—underscore sustained market cooling rather than recovery.
2. How affordable is Austin real estate right now compared to its peak?
Affordable home price pressure remains strong. The median sold price across the Austin‑Area MLS sits at $435,000, unchanged year‑over‑year, but still down 19.1% from the May 2022 peak. The average sold price is off 13.8% from its high, and price-per-square-foot values are down roughly 21‑23% depending on the metric. Even with modest 2.1% gains in sales prices year-over-year, prices remain below historic highs, offering better real entry points when compared to 2022 levels.
3. Are we seeing price stabilization or continued declines in Austin-area home values?
While mid-tier prices remain flat, higher-end homes are showing modest growth. The average sold price rose 2.1% year-over-year to $573,090, but the median sold price stayed at $435,000, signaling that mid-tier homes are not appreciating. In the City of Austin, the median sold price increased 2.3% to $588,500, while the average sold price gained 1.4%. This differential between average and median trends highlights that upper-tier demand is propping up averages while middle-market housing stays in place.
4. What’s driving increased buyer leverage in the current Austin area real estate market?
Buyer leverage is increasing due to expanding inventory and greater negotiating power. With 70.4% of homes selling below list price (up from 65.9% last month), only 12.0% selling above, and the sold-to-list ratio averaging 97.11%, buyers are winning more concessions. Additionally, builders are offering rate buydowns, closing cost assistance, and price reductions on new construction, pushing resale homes to compete harder. These buyer‑friendly dynamics create real opportunity for well‑positioned offers.
5. Is now a good time to invest in the Austin housing market?
For long‑term investors, the current market presents advantages: inventory has increased over 10% compared to last year, pricing is down from peak, and demand fundamentals remain strong due to continued population and job growth in Austin. Despite recent softness, fundamentals like economic growth, a vibrant rental market, and strong mid- to long-term equity performance support Austin’s attractiveness as an investment destination. However, investors should price competitively and focus on submarkets where absorption is faster and vacancy is lower.