Inventory Growth and Market Balance
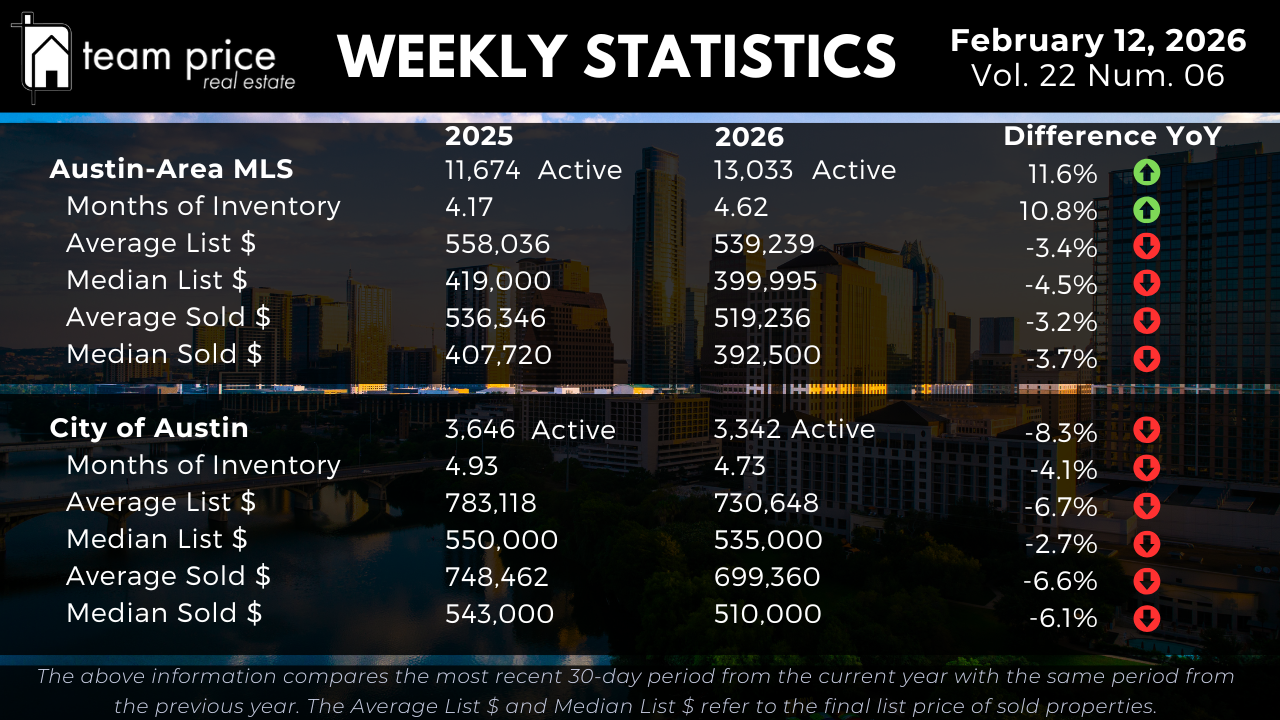
Active residential listings across the Austin-Area MLS now total 13,033, up from 11,674 at the same point last year, representing an 11.6% year-over-year increase in available supply. Inventory continues to build as new listings enter the market at a pace that exceeds closed sales. Based on current transaction volume, Months of Inventory stands at 4.62, up from 4.17 last year, a 10.8% increase. This confirms that absorption remains slower than it was one year ago. Week over week, inventory levels remain elevated, and supply has not meaningfully tightened.
Inside the City of Austin, inventory trends differ from the broader metro. Active listings have declined from 3,646 last year to 3,342 today, down 8.3% year over year. Months of Inventory has moved from 4.93 to 4.73, a 4.1% decrease. While supply is modestly lower than last year inside the city limits, sales activity has also adjusted, keeping overall balance near similar levels. Homes are not selling at a pace that would suggest strong upward pressure on prices.
Pricing Stability Across the MLS
Pricing across the Austin-Area MLS is now trending lower across both average and median measures. The average active list price has declined from $558,036 last year to $539,239, a 3.4% year-over-year decrease. The median active list price has moved from $419,000 to $399,995, down 4.5% year over year. This indicates that sellers across multiple price ranges have adjusted expectations compared to early 2025.
On the sales side, the average sold price has declined from $536,346 to $519,236, down 3.2% year over year. The median sold price has moved from $407,720 to $392,500, down 3.7%. Unlike prior periods when averages held steady while medians softened, both metrics are now moving lower together. Week over week, pricing remains generally stable, but year-over-year comparisons confirm continued price compression.
Pricing Trends in the City of Austin
Within the City of Austin, pricing adjustments are more pronounced. The average active list price has declined from $783,118 to $730,648, down 6.7% year over year. The median active list price has decreased from $550,000 to $535,000, a 2.7% decline. Sellers in the urban core continue to recalibrate pricing relative to current buyer demand.
Closed-sale data shows similar movement. The average sold price has dropped from $748,462 to $699,360, down 6.6% year over year. The median sold price has declined from $543,000 to $510,000, a 6.1% decrease. These declines are larger than those seen across the broader MLS, indicating that price adjustments inside the city have been more substantial over the past year.
Negotiation and Buyer Leverage
Negotiation remains a defining feature of the Austin housing market. So far this month, 75.24% of all closed sales across the Austin-Area MLS have sold below list price, compared to 70.22% last month. About 15.28% have sold at list price, down from 20.34% last month. Only 9.48% of properties have sold above list price, roughly in line with last month but well below February 2025, when 12.08% sold above list. The average sold-to-list price ratio stands at 96.59%, confirming that price concessions remain common across most segments.
Regional and ZIP Code Variations
Market performance continues to vary across Central Texas. Among the 30 cities tracked, 21 have recorded month-over-month price increases, while 9 have declined. Year over year, 13 cities show price increases and 17 show declines. However, when measured from peak levels over the past 12 months, all 30 cities remain below their prior highs.
At the ZIP code level, dispersion remains wide. Of the 75 ZIP codes tracked, 42 have recorded month-over-month price increases and 30 have declined. Year over year, 32 ZIP codes show price increases and 43 show declines. Only 1 ZIP code is currently above its peak price from the past 12 months, while 74 remain below peak levels. This confirms that while short-term movements vary, the broader reset remains in place.
Prices Relative to Peak Levels
Prices across the Austin-Area MLS remain materially below prior market highs. The average list price peaked in March 2023 at $708,929 and is currently around $625,619, down roughly 11.8% from peak. The median list price peaked in May 2022 at $539,900 and is currently near $429,000, down about 20.5%. The average sold price peaked in May 2022 at $664,515 and is now approximately $555,353, a decline of roughly 16.4%. The median sold price peaked at $538,000 and is now near $420,000, down about 21.9%. On a price-per-square-foot basis, both average and median values remain approximately 23% to 26% below their 2022 highs.
Within the City of Austin, peak-to-current declines are also significant. The average sold price peaked at $847,583 in May 2022 and is currently near $685,334, down about 19%. The median sold price peaked at $680,000 and is now near $532,000, down roughly 21.8%. Price-per-square-foot metrics remain approximately 27% to 29% below peak levels, confirming that valuation adjustments inside the urban core remain substantial.
Market Outlook
As February 2026 progresses, the Austin housing market continues to operate in a slower and more measured environment. Inventory across the Austin-Area MLS remains higher than last year, Months of Inventory has expanded, and most homes are selling below list price. Both average and median pricing measures are lower year over year, particularly within the City of Austin. Buyers continue to have negotiating leverage, while sellers must price realistically relative to current absorption levels.